
We have a strong track record as a resilient company meaning we work hard to make sure we’re best prepared for the future.
Over the longer term, climate change could impact on water resources resilience and the integrity of our assets. Our Resilience Framework provides a structure for us to achieve resilience in the round by taking an integrated and systematic approach to understanding risk and resilience challenges across all of our business areas and how they interact. Resilience was a key element of our PR19 Business Plan.
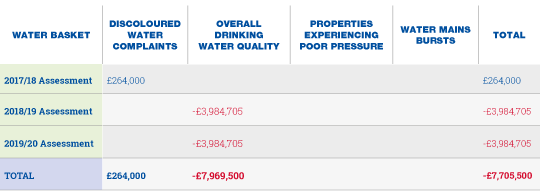
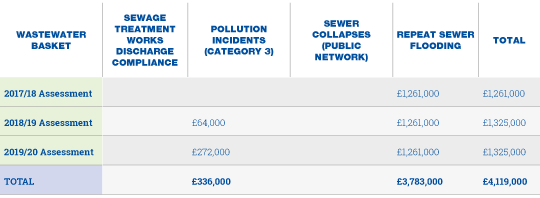
Our performance is measured by splitting this into two groups known as asset health baskets: water services and wastewater services
For more information on the individual measures of success, click the links
Performance measurements relating to water asset health are:
Overall drinking water quality compliance
Properties experiencing poor pressure
Performance measurements relating to wastewater asset health are:
Sewage Treatment Works discharge compliance
Pollution incidents (Category 3)
Sewer collapses (public network)
This is focused on the long-term stewardship of our assets (such as our reservoirs and infrastructure), so performance is based on a three-year rolling average basis. Assessments were made at the end of 2017/18 and 2018/19 periods and we are now making the final assessment at the end of 2019/20.
We have reported on both the annual and three-year average performance for each of the asset health measures within this report. The table below summarises the overall financial impact of asset health performance.
Net impact for Asset Health is a penalty of £3,586,500 over the five-year period.
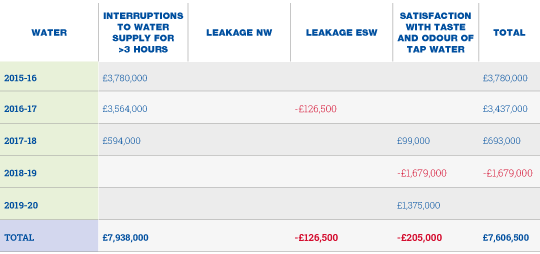
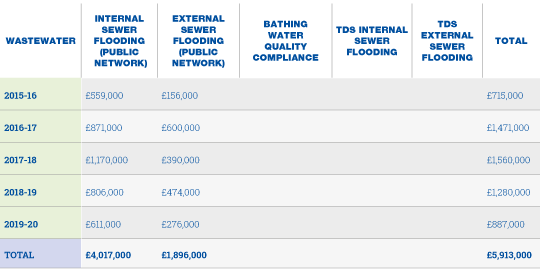
When we take individual financial ODIs into account the net impact for all ODIs is £9,933,000.
For completeness, other individual financial ODIs and the penalties or rewards earned are shown in the following tables.
We are resilient and provide clean drinking water and effective sewerage services, now and for future generations.
A number of new measures will be introduced for 2020-25. They are:
- Risk of severe restrictions in a drought
- Risk of sewer flooding in a storm
- Sewer flooding risk reduction
There will also be a series of measures relating to delivery of enhancement programmes of work.
In a business where we are aiming to constantly improve customer service levels and efficiency, we need to be much smarter at identifying, predicting and targeting resources towards risks.
We’ve always believed that most of the information we need to run our business efficiently is currently “known” to us. The challenge has been to identify its whereabouts, at what point do we need to act upon it, and who has the capacity and capability to carry out those actions.
Our DRIVE project was created to bring all of the information, systems and processes of our business together so we can tackle risks in a more measured and focused way.
By collecting information generated every second from 30,000 data points across our operations we can now get a better view of our entire business.
This single system means we weigh up issues to calculate risks and focus efforts and the right people before these risks impact on performance.
These are a few examples of the change in culture this is delivering:
- More visible and robust operational action plans to mitigate risk
- 30% reduction in underlying risk score thanks to improved operational focus on specific issues
- Less reliance on “technical experts” due to a higher level of operational understanding.