We provide a sewerage service that deals effectively with sewage and heavy rainfall
Each one of us generates around 180 litres of waste a day. That’s a lot of ‘stuff’ going into our sewer system. We all have a part to play in keeping our sewers healthy.
We measure our performance in seven ways:
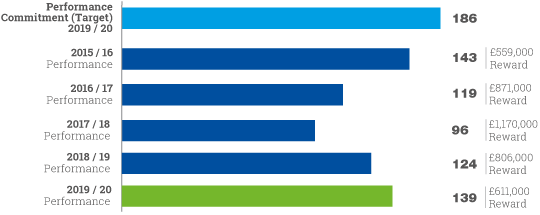
Our target for number of properties flooded internally from our public network is 186 and we did better than that – with 139 properties reporting issues.
Despite a small increase from 124 properties in 2018/19, we have demonstrated an overall good performance in reducing the risk of internal sewer flooding for our customers. This strong performance means we have earned a reward of £611,000.
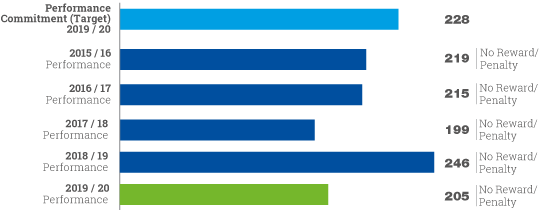
This measure is linked to the performance of sewer pipes that transferred into our ownership in 2011 under the transfer of private drains and sewers (TDS).
Sewerage investigations, surveying and mapping of our TDS network continues to improve each year and this will help us to further improve our sewer flooding performance in this area.
Our target for the number of properties flooded internally from the TDS network was 228 properties. We did better than that in 2019/20 – 205 properties were affected.
This performance has improved from last year but not enough to earn us a reward.
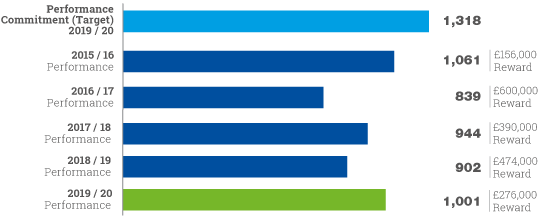
Our target for the number of properties flooded externally from the public network is 1,318 properties. We did better than that, with 1,001 properties affected in 2019/20.
Though this is a slight increase from 902 properties in 2018/19, our performance was strong enough to earn us a financial reward of £276,000.
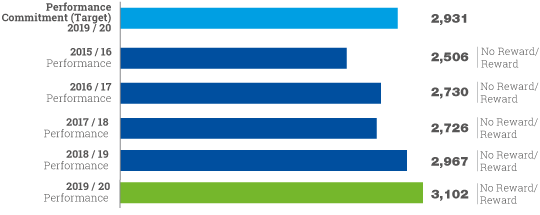
This measure is linked to the performance of sewer pipes that transferred into our ownership in 2011 under the transfer of private drains and sewers (TDS).
Our target for the number of properties flooded externally from our TDS network was 2,931. We recorded 3,102 properties, an increase from 2,967 in 2018/19.
This rise is not significant enough to earn us a financial penalty.
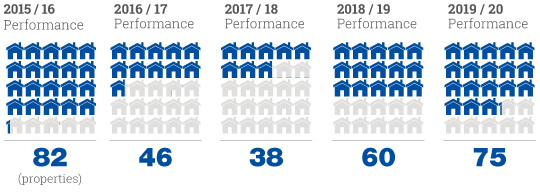
Repeat sewer flooding measures the number of times during the year that properties have experienced sewer flooding, where the property or its garden has flooded previously in the last 10 years.
The number of properties subject to repeat sewer flooding has increased from 60 properties in 2018/19 to 75 properties in 2019/20.
Sustained periods of wet weather over the past year has impacted our performance in this area.
We recognise that repeat sewer flooding is one of the worst service failures that our customers can experience, and we have committed to improving our performance in this area in our 2020/2025 business plan.
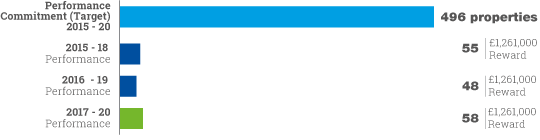
Three-year average performance
Our target for repeat sewer flooding is assessed on a three-year average performance. Our target was 496 properties and we did much better than that – with 58 properties affected.
Our effectiveness at dealing with this issue between 2017-20 means we have earned a financial reward of £1,261,000.
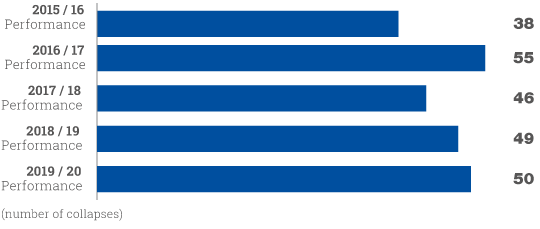
Occasionally the structure of a sewer pipe fails and the pipe “collapses”. This can be caused by reasons including the age and condition of the pipe. Other factors such as ground movement and damage by other people can also be to blame. A collapsed sewer may lead to other problems, such as flooding or pollution.
The number of sewer collapses on the public sewer network slightly increased from 49 in 2018/19 to 50 in 2019/20.
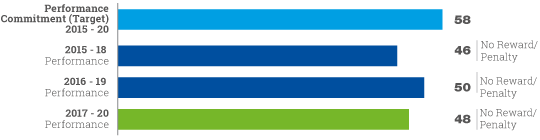
Three-year average performance
Our target for sewer collapses on the public network is assessed on a three-year average performance. Our target was 58 incidents and we did better than that – we had 48.
Though we beat our target, our performance has not earned us a financial reward.
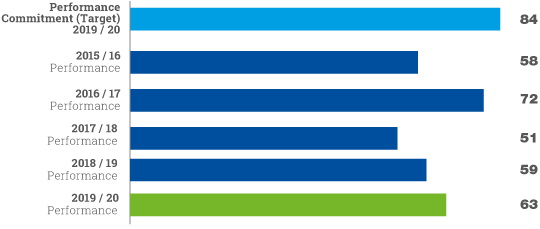
This measure is linked to the performance of sewer pipes that transferred into our ownership in 2011 under the transfer of private drains and sewers (TDS).
Our target for the number of sewer collapses in the TDS network was 84 incidents and we did better than that – we had 63.
This was a slight increase of the year before when there were 59 incidents, and we did not earn a reward.
Our sewerage service deals with sewage and heavy rain effectively.
Updated flooding and collapses measures, which cover the entire sewer network, will be used throughout 2020-25. They will cover:
- Internal sewer flooding
- External sewer flooding
- Repeat sewer flooding
- Sewer collapses
New measures introduced will cover:
- Sewer blockages
Every year we have to remove around 15,000 blockages from our sewer network, approximately 64% of which are caused by people flushing wipes.
Even brands of wipes that have the word “flushable” on the packet can contribute to this problem.
These blockages can cause sewage to back up into customers’ homes or to flood into the environment, affecting rivers or beaches. We want to stop this happening, and encourage everyone to ’Bin the Wipe’.
In the past, we have tried a softer approach encouraging people to put only ‘the three Ps’- toilet paper, pee and poo down the loo. However, as the problem of blockages caused by wipes persists so we are becoming firmer in the way we talk about avoidable blockages, and how we deal with households which we can identify as repeat offenders.
Our aim is to create real, sustainable, behavioural change that protects customers, their homes and the environment.
In November 2019 we launched our new customer behaviour change campaign, ‘Bin the Wipe’. To date our PR coverage has reached over 35 million customers and our social campaign posts have reached over one million people, drawing more than 70,000 engagements.
We have had continued support from a wide range of partners, including local authorities who have re-affirmed their support for #BinTheWipe.
Alongside this overarching campaign, we also launched three targeted pilots in hot spot areas - Newcastle, Stockton and Redcar - with the aim of reducing the amount of blockages caused by wipes in our sewer network. The three pilots are:
- Redcar – The Big Bin Giveaway
During our research we found that 54% of households did not have a bin in any bathroom. We door knocked all households in this area to explain how flushing wipes can block the sewer network, and how that can contribute to sewer flooding. We also gave each household a bin to put their wipes in. So far we have seen a 43% reduction in wipes within the network. - Stockton – Making blockages a moment of change
We wrote to all the households in this area to let them know we would be using smart technology to pinpoint which houses are flushing wipes. We also shared imagery of houses that have been flooded in the area because of blockages caused by wet wipes, to give a clear, hard hitting message that it’s important for this to stop.
There is a five-stage process from educating customers with letters and doorstep conversations, through to charges for costs incurred, and even possible prosecution for sewer misuse. So far, we have seen a 61% reduction in wipes within the network.
- NE1-NE7 – Getting into good make up habits
Research has shown that over 50% of the wet wipe blockages we have to clear, are wipes that have been used for removing makeup.
We launched a specific makeup focused ‘Bin the Wipe’ campaign in the NE1-NE7 postcode area, focusing on sharing messages about alternative products people can use to clean their face. This area was chosen for its high incidence of blockages and its demographics.
Our Bin the Wipe advertising had a reach of up to 4 million, and we attended three events where nearly 200 Bin the Wipe pledges were signed. We also employed social media ‘Influencers’ to communicate this message.