We provide a reliable and sufficient supply of water
When you turn on your tap, you can expect a reliable and sufficient supply of water.
To improve this performance, we focus on reducing leakage from our water network and water mains bursts, as well as reducing interruptions to supply and the number of properties affected by low pressure.
We measure our performance in five ways:
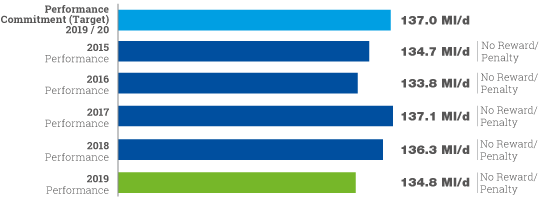
Leakage from the water network is measured in megalitres (millions of litres) lost per day.
Leakage levels fluctuate throughout the year as the weather changes and we report the average daily level at the end of the year.
Our target was 137.0 Ml/d and we did better than that by reducing leakage to 134.8 megalitres per day (Ml/d) in 2019/20.
This reduction was not low enough to earn us a financial reward.
We have continued to invest in system repairs and processes to help us detect and prioritise leakage incidents within our network. Innovation remains at the heart of our efforts and we continue to trial new technologies to improve efficiency.
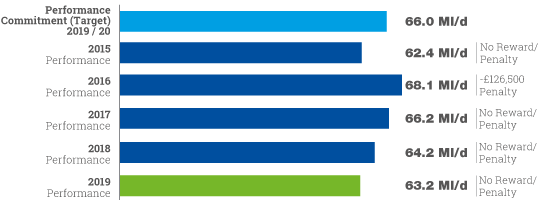
Our target was 66.0 megalitres per day (Ml/d) and we did better than that by reducing leakage to 63.2 Ml/d in 2019/20.
This is not low enough to earn us a financial reward.
Lessons learned from the dramatic weather of 2018 continue to benefit our performance when it comes to reducing leakage.
Freezing and thawing pipes caused by the ‘Beast from the East’ followed by the challenges of a hot summer meant our infrastructure and teams came under pressure in 2017/18.
Innovative steps taken to deal with these bursts and leaks put us in a good position for future performance. The milder weather of 2019/20 helped too, providing stable ground conditions that protect pipes from bursting and leaking.
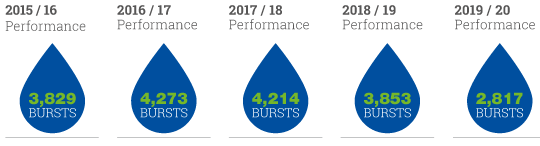
The number of water mains bursts is measured by counting the number of repairs we make to water mains each year.
Our annual performance shows we have had far fewer failures across our networks in 2019/20 (2,817 bursts) compared to 2018/19.
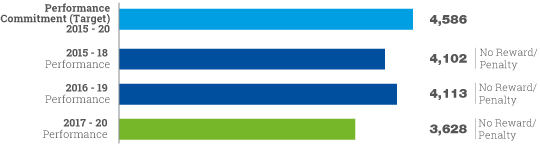
Three-year average performance
Our target is based on a three-year average performance. Our target was 4,586 mains bursts and we achieved 3,628, which is well below that figure.
As the graph below shows, this performance did not earn us a financial reward.
We replace sections of our vast network of water pipes each year to minimise the risk of bursts. In 2019/20 we replaced 48.5 km of pipes in the north and 21.1 km in the south.
We have progressed with an innovative project looking at how we can reduce bursts in the future by better managing ‘pressure transients’. These are high pressure shocks that reduce the life of water pipes and cause bursts.
The mild weather of 2019/20 also played a significant role in reducing the number of mains failures across the network, putting less strain on any weak points.
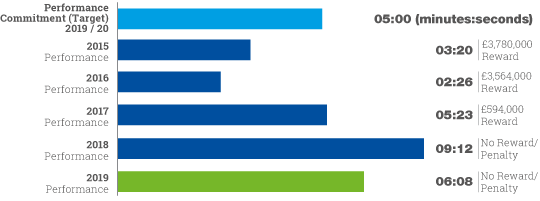
Our target is an average of 5:00 minutes of interruptions lasting longer than three hours per customer. We achieved 6:08 minutes.
We will not have to pay a penalty because we set our target at a high level that is significantly better than the industry average.
An interruption to the water supply can occur when we carry out planned maintenance or unexpectedly when a burst or other failure occurs in the network.
We know these interruptions can cause our customers real inconvenience, especially when they are unexpected and without warning. So, we are committed to reducing them.
For this measure, all interruptions of three hours or longer are added up to give a total time that customer supplies were lost across our supply area. We then divide this total time by the number of properties we serve.
This gives an average number of minutes and seconds we have interrupted each customer for three hours or longer.
Our performance in this area deteriorated in 2018/19. So, we have been busy reviewing all the factors that caused this and now have plans in place to prevent a repeat occurrence.
This includes:
- Use of temporary supply equipment wherever possible to keep water flowing
- Refresher training for employees to ensure they understand how their actions impact on performance
- Work with partners to improve prioritisation and response to alarms
- Investment in new equipment and pressure management, to reduce issues in the network that can cause an interruption
Interruptions to supply of 1-3 hours
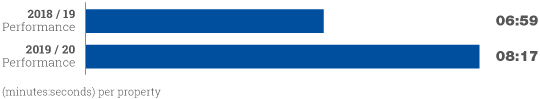
We recently also began measuring shorter interruptions to supply so we can make improvements to this performance.
We committed to publishing three years of data from 2018/19 through to 2020/21 to establish a baseline level of performance from which we can then measure our rate of improvement.
Poor pressure is usually caused by deteriorating water mains or water pumps and means the flow from your taps is reduced.
We measure the number of customers who are experiencing poor pressure - defined using an industry standard level of pressure equivalent to being able to fill up a 15 litre bucket in 100 seconds.
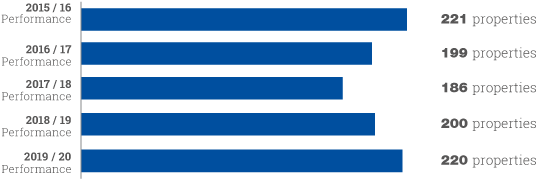
We monitor and investigate water pressure in the network so that we can identify customers who are not receiving pressure at this standard and take action. Properties which are not receiving the minimum standard pressure are added to a register.
During 2019/20 we invested to increase the pressure for 947 customers, leaving 220 properties on the register at the year end. This is an increase on the number of properties on the register at the end of 2018/19, which was 200.
Three-year average performance
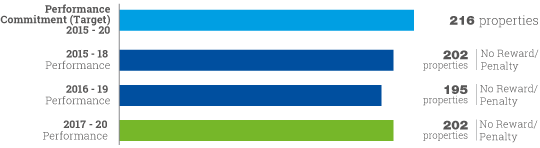
Our target for the number of properties affected by low pressure is based on a three-year average performance. The target was 216 and we did better than that – with 202 properties.
Though we improved on our target, it is not enough to trigger a reward.
We always provide a reliable supply of water.
The following measures will continue throughout 2020-25:
- Water supply interruptions over 3 hours
- Interruptions to supply 1-3 hours
- Leakage (two measures - NW and ESW)
The above measures will be supplemented with performance commitments for:
- Interruptions to supply greater than 12 hours
- Mains repairs
- Unplanned outage
- Per capita consumption (PCC)
Did you know that between 5% and 8% of properties have a leaking toilet, each wasting between 200 and 400 litres of water a day?
This means approximately 105,000 homes are wasting around 23Ml/d of water daily. That’s roughly equivalent to the daily output of clean water by produced our Wear Valley Water Treatment Works being wasted down our customers’ loos.
To reduce this wastage, we’ve introduced a service where we help customers identify if their toilet is leaking and repair it for them if it is.
The benefits are clear for the customer. If you are metered, you’ll save a huge amount of money – around £200 on your annual water and sewerage bill. We’re also providing simple tools to identify other internal plumbing losses.
Our Leaky Loo programme delivers a number of benefits to us too. The repair of one leaking toilet saves as much water as ten home water efficiency retrofit visits so it is a very cost-effective solution when it comes to delivering our ambitious Per Capita Consumption targets.
It’s great for improving customer experience [link to C-MeX] as we’re delighting our customers and hopefully, they will spread news of their positive experience. It’s also contributing to our goal to eradicate water poverty by 2030 as we help fix internal leaks and reduce customers’ bills.
In the past year we identified and repaired over 2,000 leaking toilets for our customers, saving 430,000 litres per day at a conservative estimate. Our ambition is to scale this up over 2020-25.