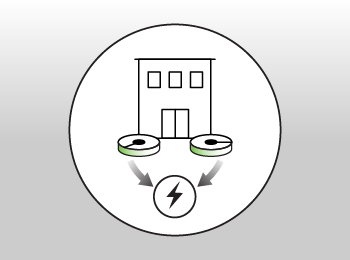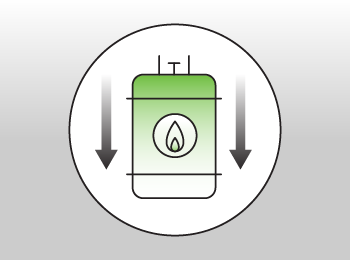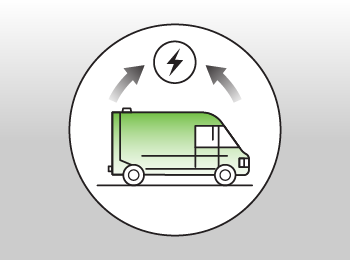
The sources of our emissions are set out in the chart below.
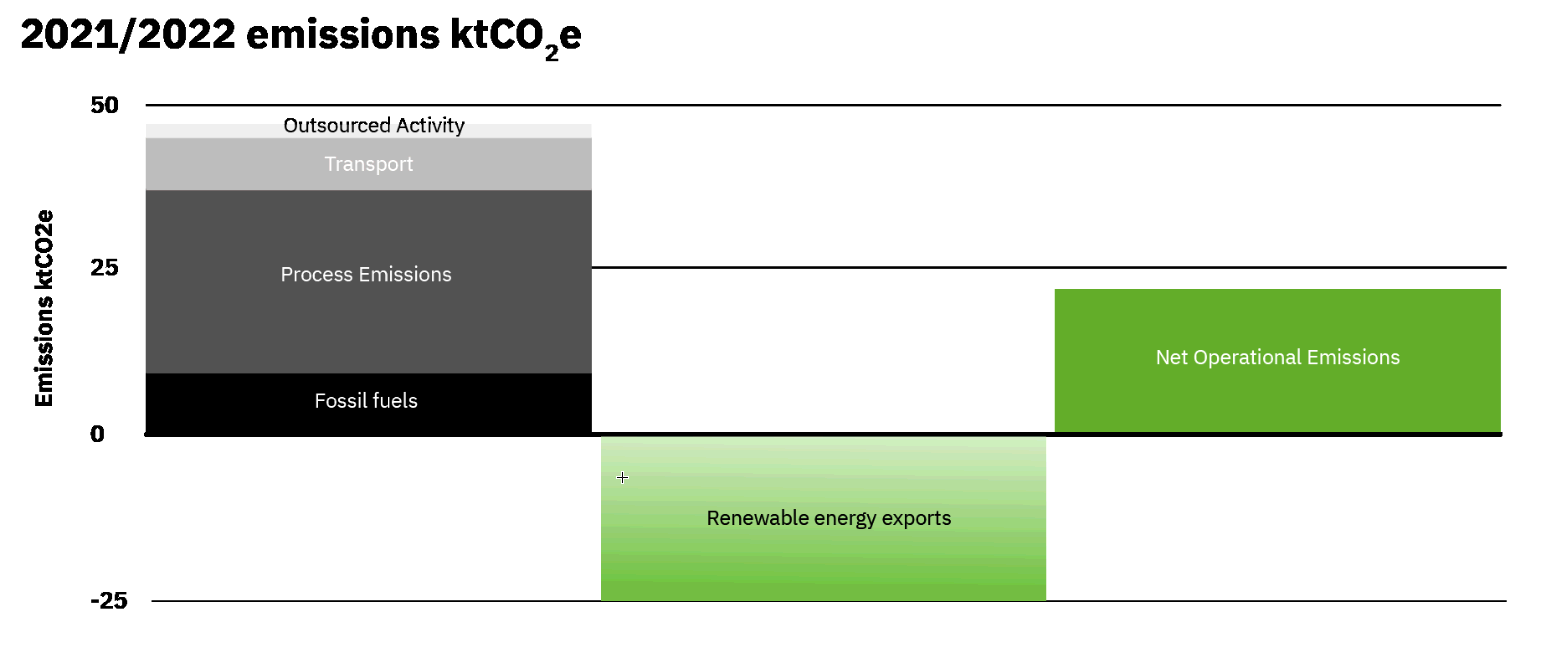
Each of the sources shown in the chart represents its own unique challenge to our business, but our commitment to do everything we can, as soon as we can, means we are set to make significant progress along our journey to net zero.
